
Sri Sarada College of Education (Autonomous), Salem -636016is highly committed to provide quality teacher education to the student teachers who are mainly from rural background. Educating the students with this background creates many challenges and we are committed to face these challenges in an effective manner. To ensure continuous improvement the requirements of the students have to be carefully identified for which we use the mechanism of obtaining the feedback. This survey has been done every year with a sample of around 50 students.
The IQAC of this college took the lead in conducting the Student Satisfaction Survey on - line in June 2019 by the academic staff. The survey results were electronically tabulated and printed by IQAC for analysis and continualimprovement in processes and systems. The analysis was compiled into a survey report which was submitted to themanagement council for review and approval prior to implementation of recommended improvement actions. Survey report is available in the college web portal.
The Students Satisfaction Survey was done online using Googleforms. Hence this digitized process is paperless and green. The online mode of data collection ensures speedy acquisition of information and prompt analysis. The survey was done with 48 student teachers. The consolidated analysis and the findings are given as diagramsas below.
The feedback process is effectively used as a mechanism to identify the following:
These generally revealed that student teachers were highly satisfied with their study experiences in this esteemed institution in Salem.
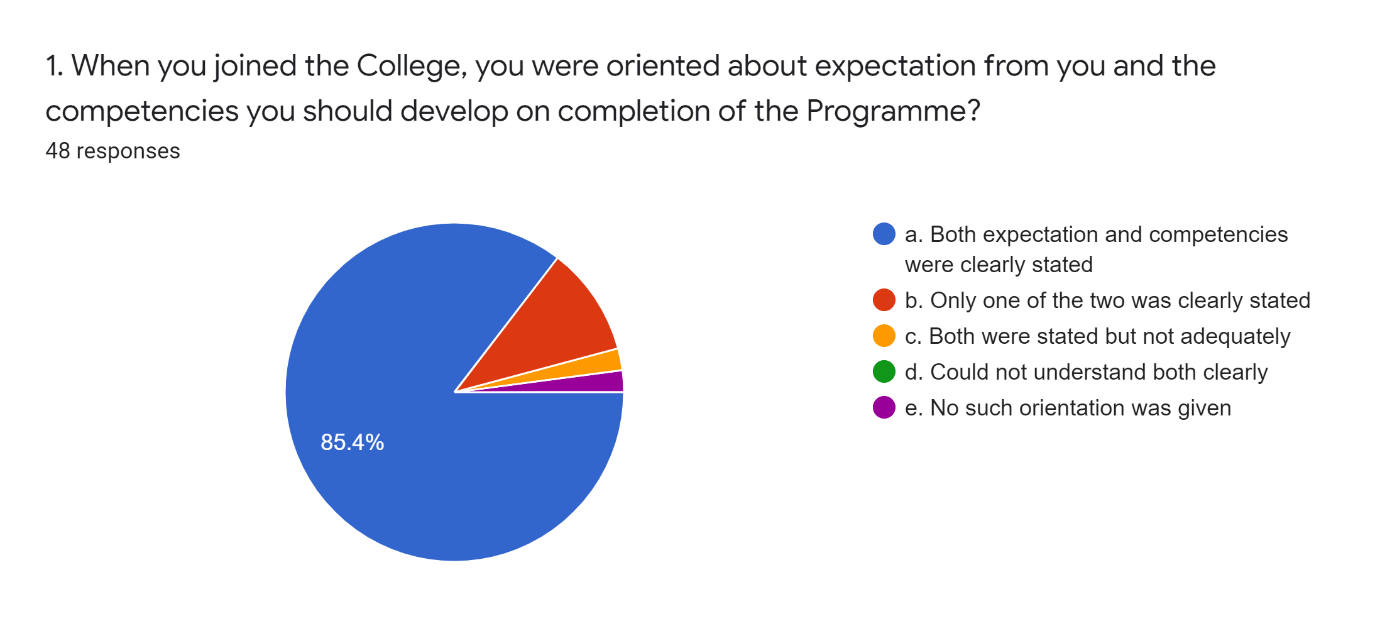
Out of 48 participants, 42 respondents (85.4 %) replied that ‘both expectation and competencies were clearly stated’; followed by 5 (10.2 %) stating ‘only one of the two was clearly stated’. Only 1 participant (2 %) each selected the options ‘both were stated but not adequately’, and ‘No such orientation was given’ respectively. None selected the option ‘could not understand both clearly’.
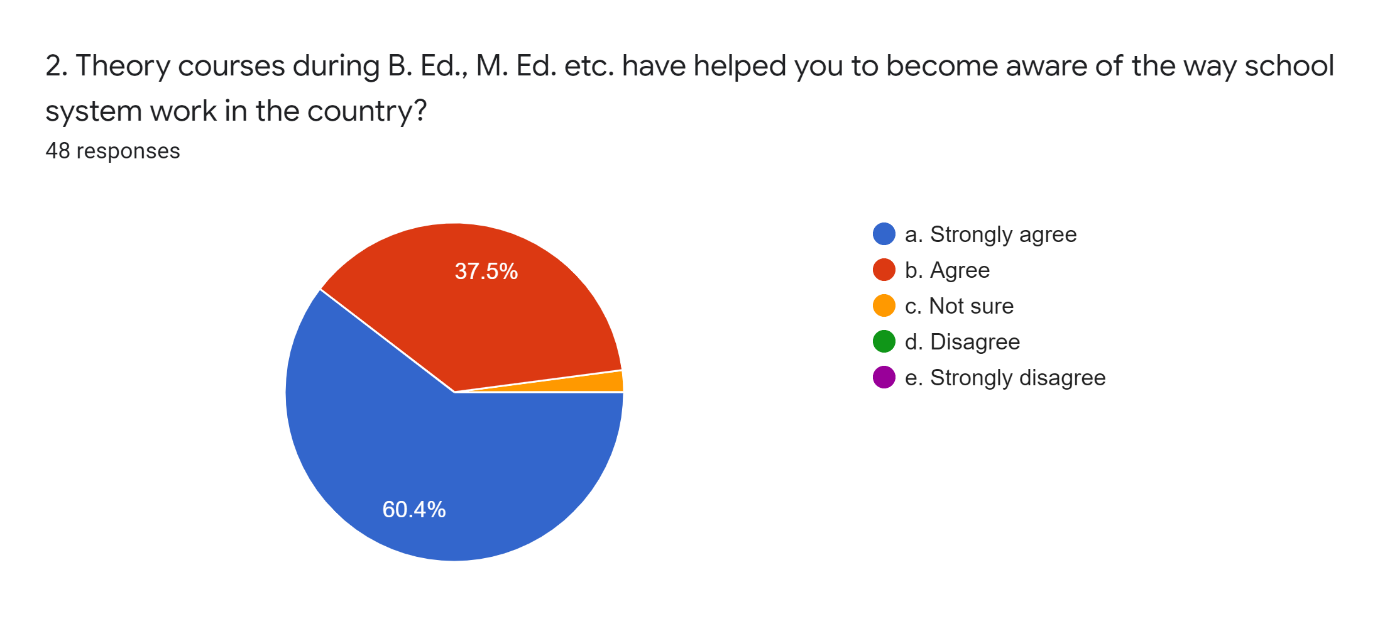
Out of 48 participants, 28 respondents (60.4 %) selected the option ‘Strongly Agree’ followed by 19 (37.5 %) stating ‘Agree’ and 1 (2 %) responded ‘Not Sure’ respectively. None has selected the options ‘Disagree’ and ‘Strongly Disagree’.
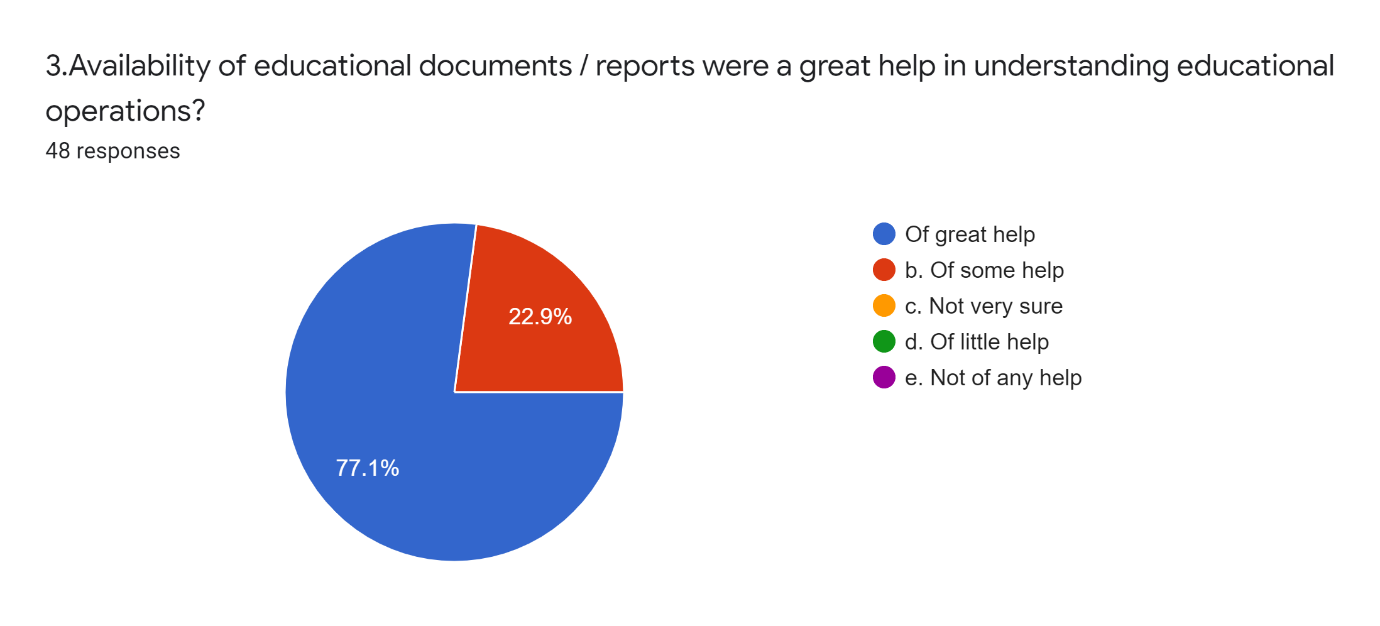
Out of 48 participants, 37 respondents (77.1 %) replied ‘of great help’; followed by 12 (22.9 %) stating ‘of some help’. None selected the options ‘Not very sure’ ‘of little help’ and ‘Not of any help’.
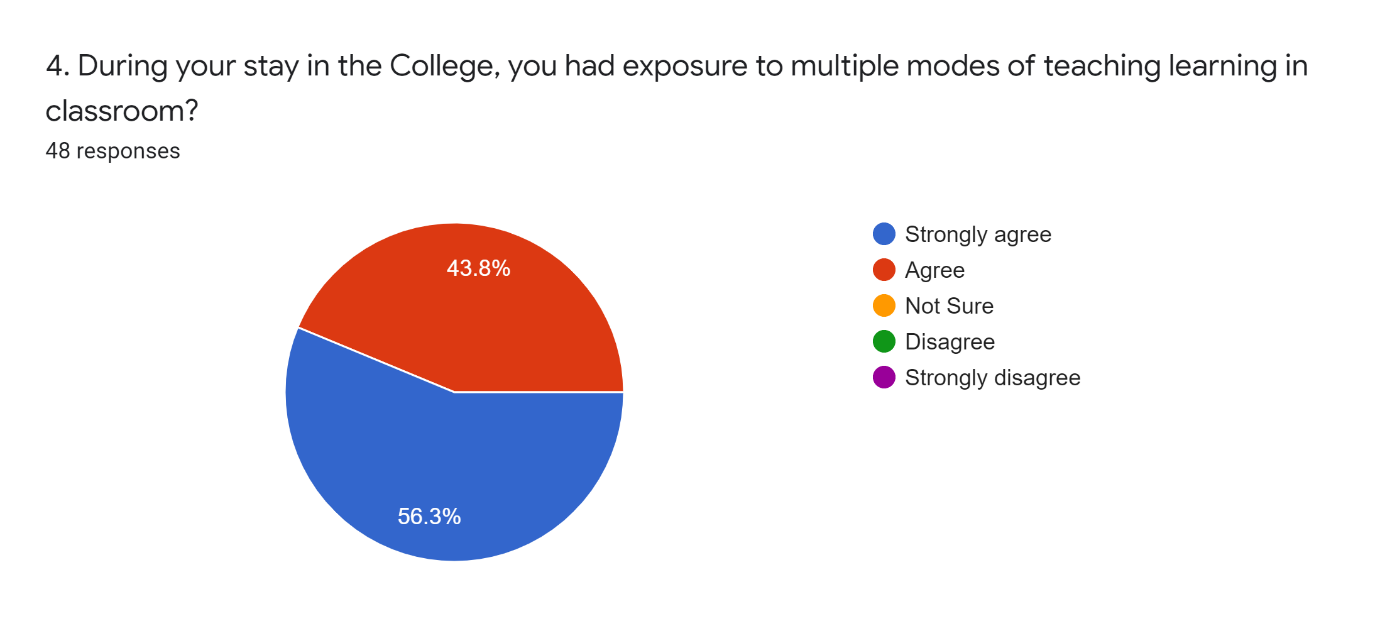
Out of 48 participants, 26 respondents (56.3 %) selected the option ‘Strongly Agree’ followed by 22 (43.8 %) stating ‘Agree’. None has selected the options ‘Not sure’ ‘Disagree’ and ‘Strongly Disagree’.
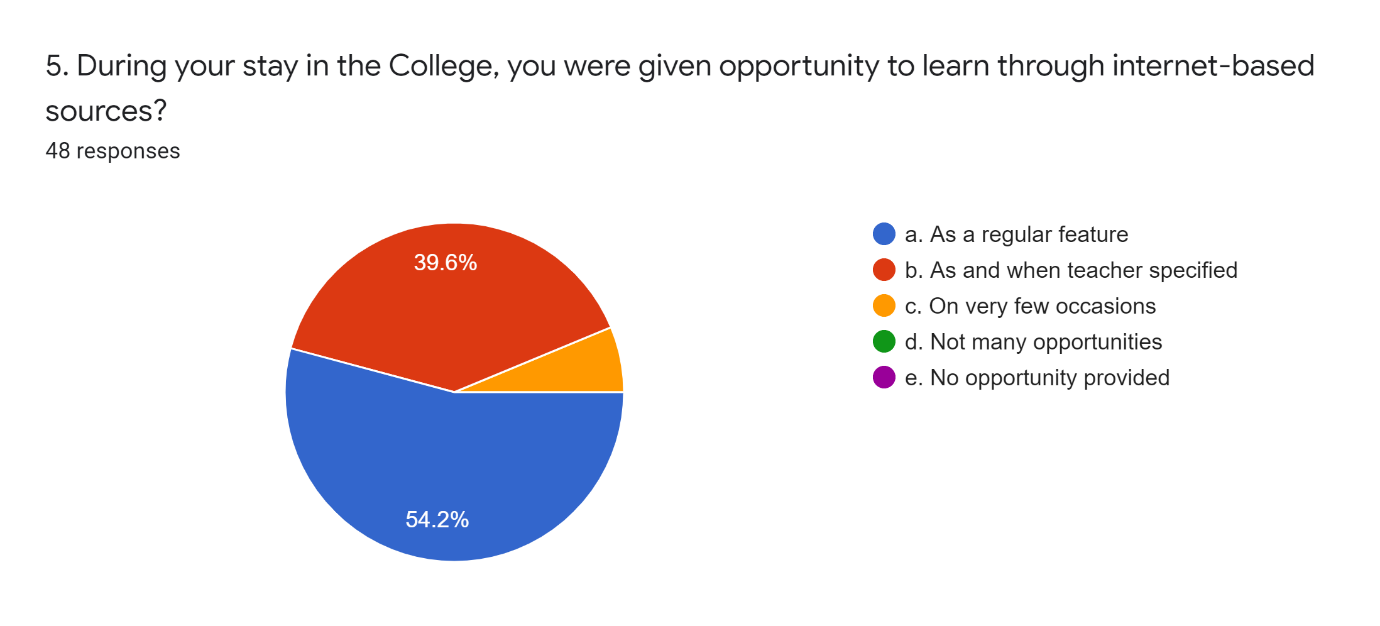
Out of 48 participants, 25 respondents (54.2 %) replied the option ‘As a regular feature’; followed by 20 participants (39.6%) stating ‘As and when teacher specified’. Only 3 participants (6.1 %) selected the option ‘On very few occasions’. None selected the options ‘Not many opportunities’ and ‘No opportunity provided’.
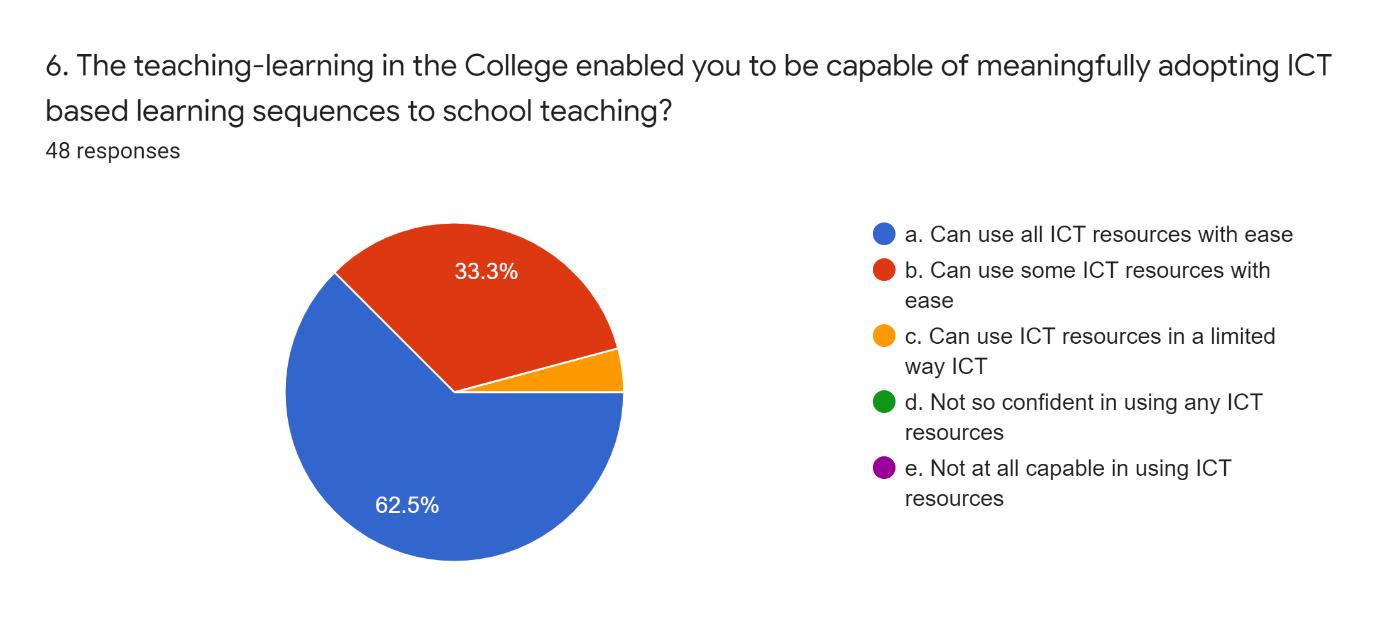
Out of 48 participants, 30 respondents (62.5%) replied ‘Can use all ICT resources with ease’; followed by 16 (33.3 %) stating ‘Can use some ICT resources with ease’. Only 2 participants (4.1%) selected the option ‘Can use ICT resources in a limited way ICT‘. None selected the options ‘Not so confident in using any ICT resources’ and ‘Not at all capable in using ICT resources‘.
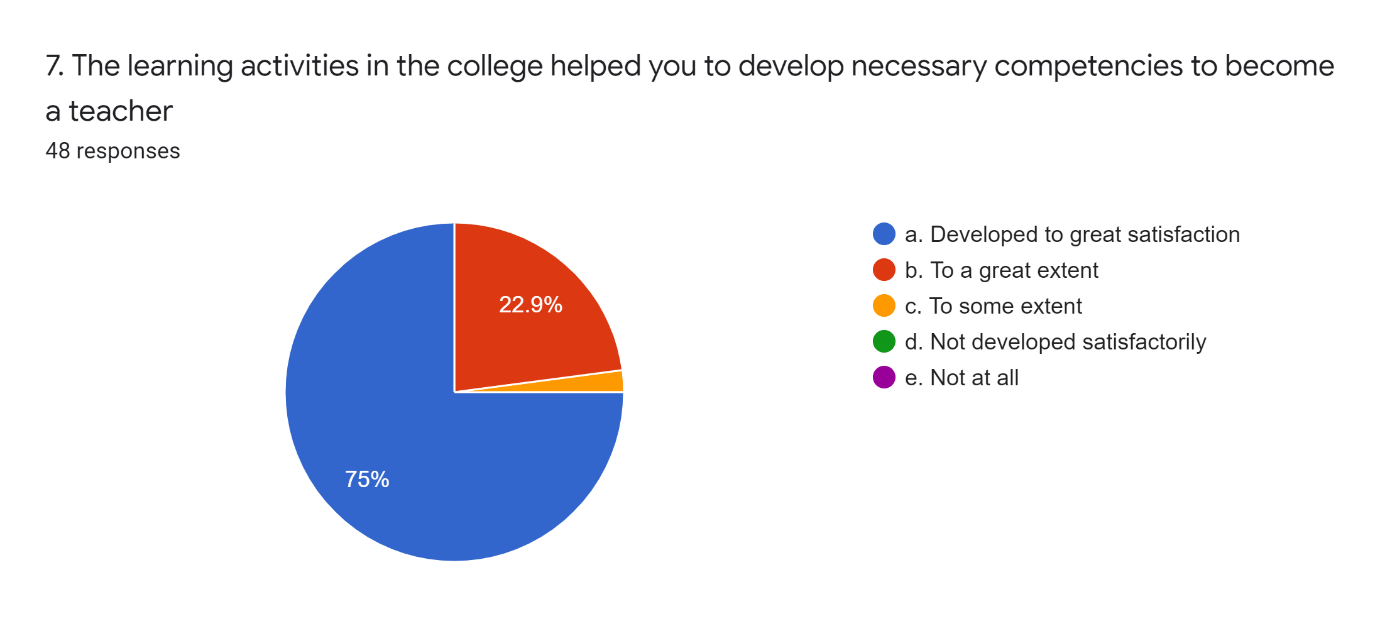
Out of 48 participants, 37 respondents (75 %) replied that ‘Developed to great satisfaction’; followed by 10 (22.9 %) stating ‘To a great extent’. Only 1 participant (2 %) selected the option ‘To some extent’ respectively. None selected the options ‘Not developed satisfactorily’ and ‘Not at all’.
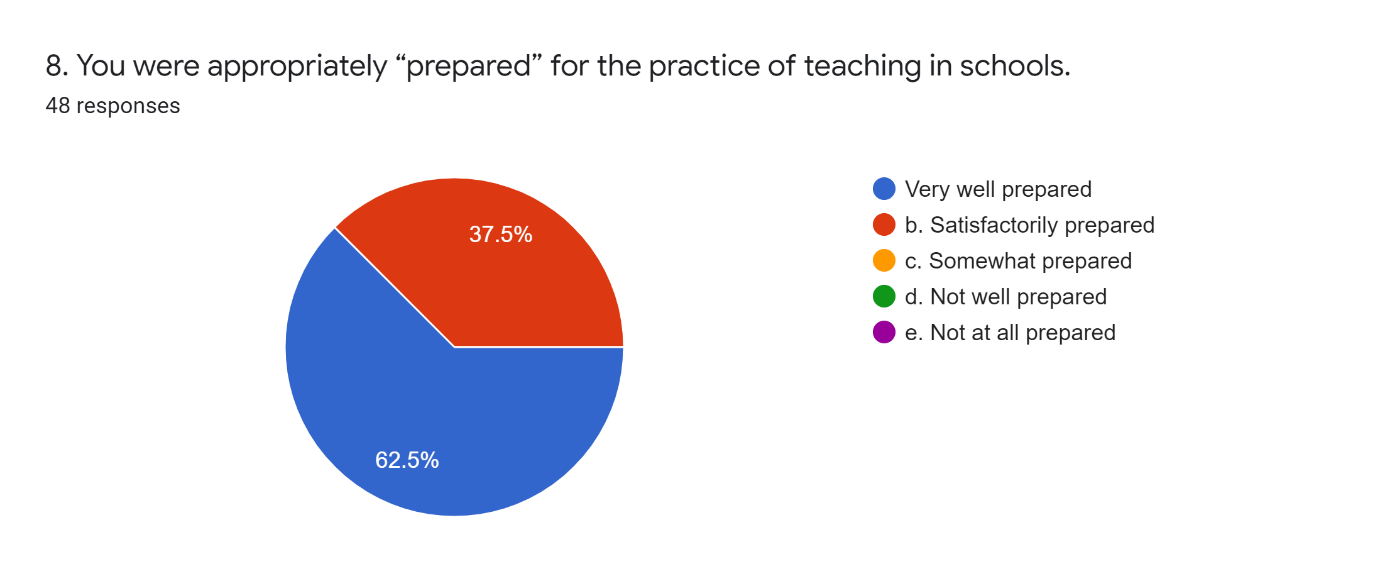
Out of 48 participants, 31 respondents (62.5 %) replied ‘Very well prepared’; followed by 17 (37.5%) stating ‘Satisfactorily prepared’. None selected the options ‘somewhat prepared’ ‘Not well prepared’ and ‘Not at all prepared’.
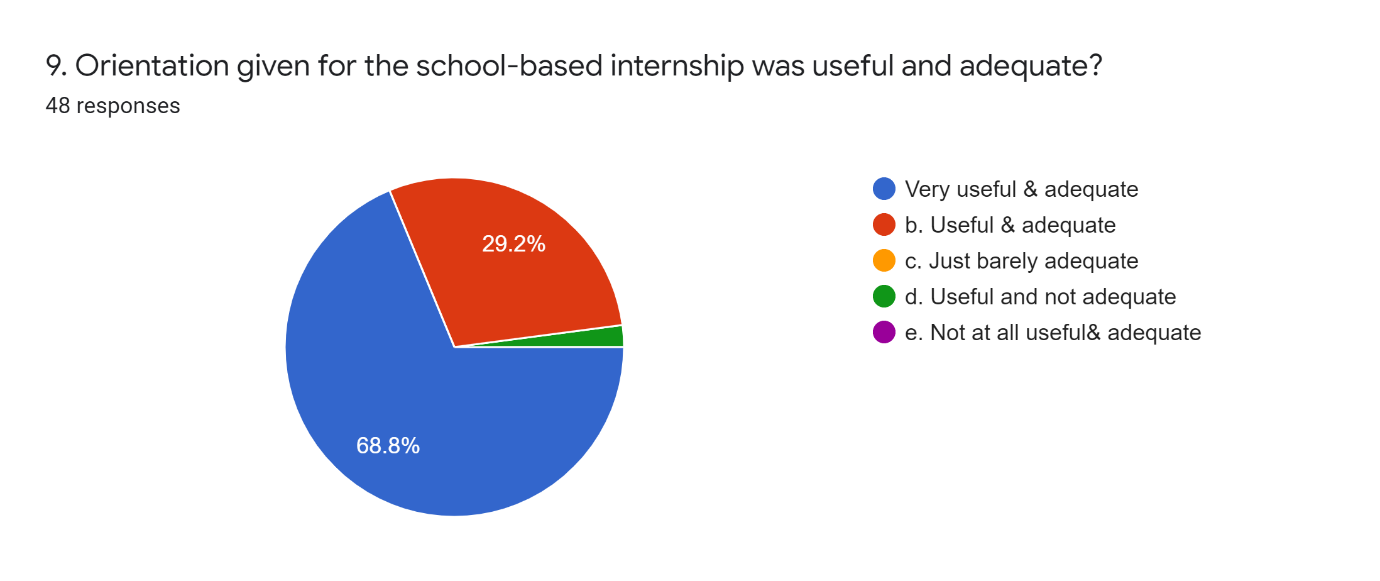
Out of 48 participants, 33 respondents (68.8 %) replied that ‘Very useful & adequate’; followed by 14 (29.2 %) stating ‘Useful & adequate’. Only 1 participant (2 %) selected the option ‘Usefuland not adequate’. None selected the options ‘Just barely adequate’ and ‘Not at all useful &adequate’.
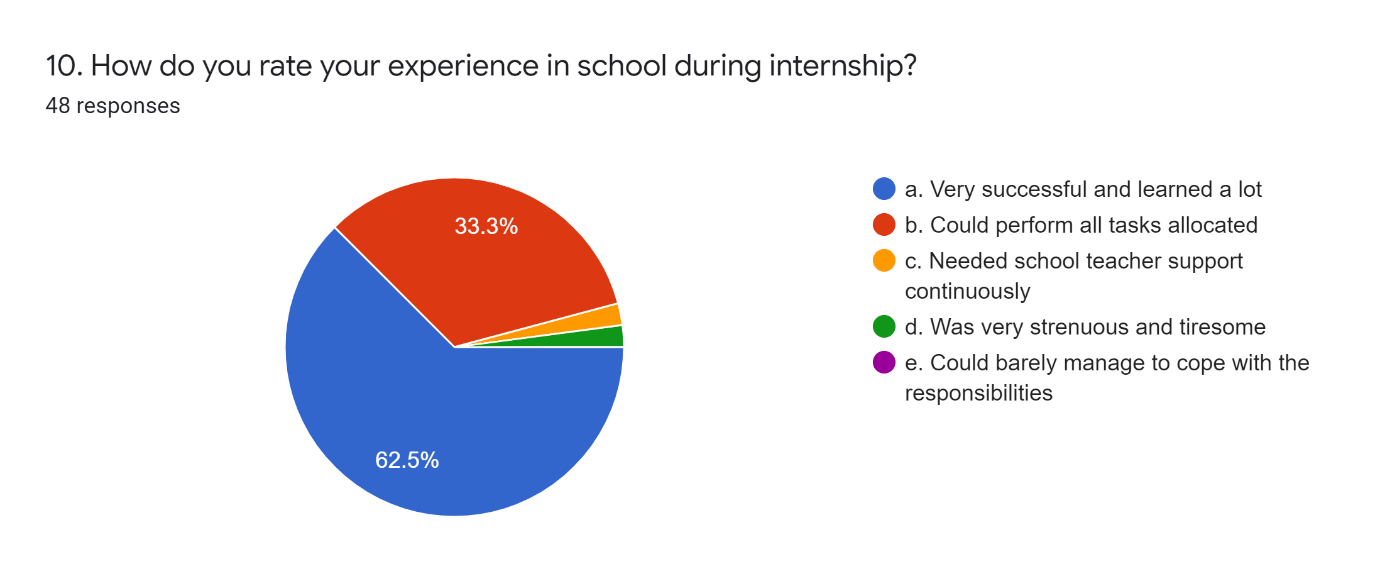
Out of 48 participants, 31 respondents (62.5 %) replied ‘Very successful and learned a lot’; followed by 16 (33.3 %) stating ‘Could perform all tasks allocated’. Only 1 participant (2 %) each selected the options ‘Needed school teacher support continuously’, and ‘Was very strenuous and tiresome’ respectively. None selected the option ‘could barely manage to cope with the responsibilities‘.
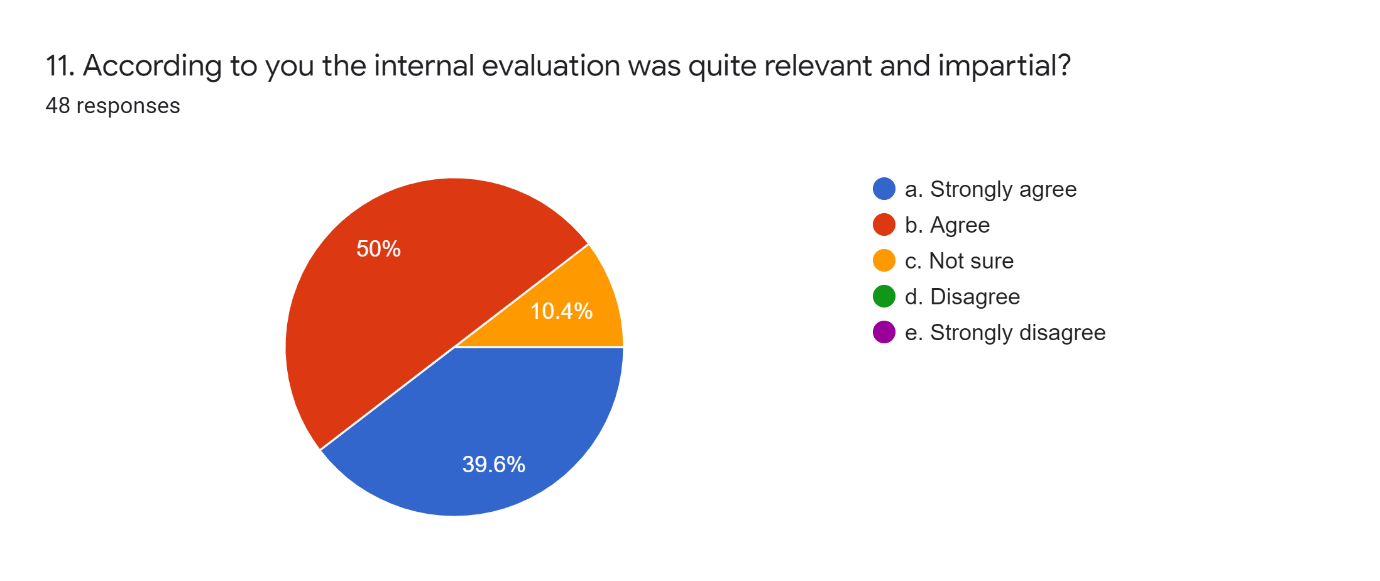
Out of 48 participants, 20 respondents (39.6 %) replied ‘Strongly agree’; followed by 24 (10.4 %) stating ‘Agree’. Only 4 participants (2 %) selected the option ‘Not sure’. None selected the options ‘Disagree’ and ‘Strongly disagree’.
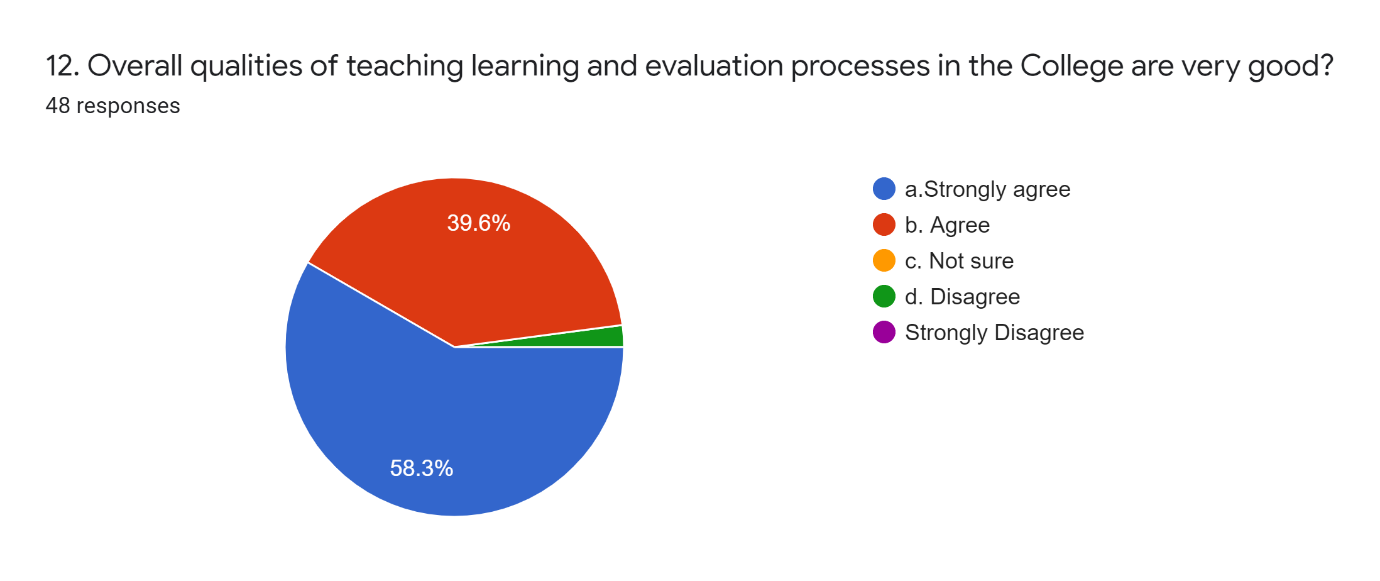
Out of 48 participants, 28 respondents (58.3%) replied ‘Strongly agree’; followed by 19 (39.6 %) stating ‘Agree’. Only 1 participant (2 %) selected the option ‘Disagree’, respectively. None selected the options ‘Not sure’ and ‘Strongly disagree’.
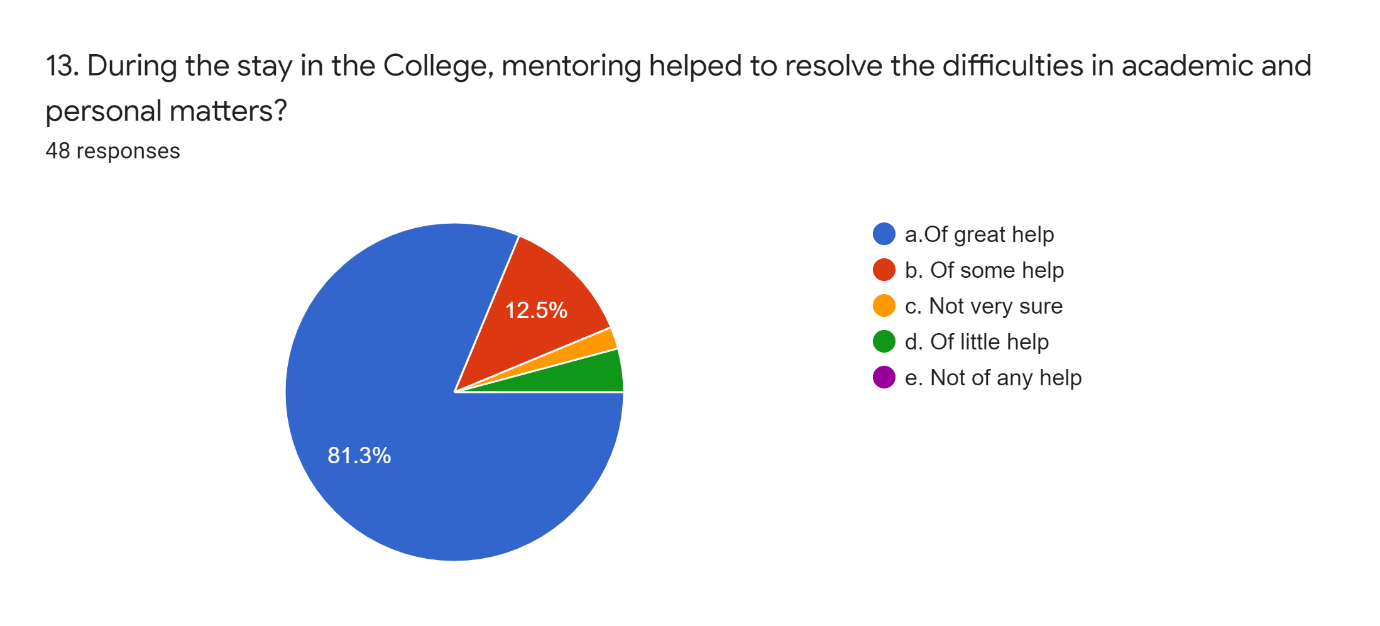
Out of 48 participants, 40 respondents (81.3 %) replied ‘of great help’; followed by 6 (12.5 %) stating ‘of some help’, Only 2 participants (4.1%) each selected the options ‘Not very sure’ and ‘Of little help’ respectively. None selected the option ‘Not of any help’.
The following are the thrust areas of improvement as revealed by the feedback. Eventhough the percentage of students who say that ‘some areas require improvement’ is very less (around 10%), we perceive this as potential areas for continual improvement.
Around 58.3% of student teachers strongly agree the qualities of Teaching, Learning and Evaluation processes. 39.6% have agreed that the college is very good. Two percentage feels to improve the Teaching-Learning processes. From this exclusive survey, around 96% of the students responded that they were highly satisfied with the services rendered by our college.With the implementation of the improvement actions identified in this survey, we will be expecting better results in next Academic year 2019-2021.